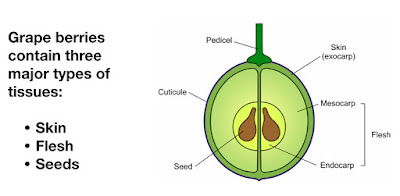
Grape berries exhibit a double sigmoid growth pattern.
The First Growth Phase:
- occurs from flowering to approximately 60 days post flowering
- growth occurs mainly by cell division causing the berry to expand
- tartaric and malic acids are the most prevalently accumulated compounds during the first growth phase
- tartaric acid is accumulated during the initial phase it's concentration is highest in the periphery of the grape berry
- malic acid is accumulated in the flesh cells at the end of the first growth phase
- hydroxycinnamic acids accumulate in the flesh and skin of the berry
- tannins, including the monomeric catechins, accumulate in the skin and seed tissues but nearly absent in the flesh
- the length of the lag phase is specific to the variety
- the end of the lag phase corresponds to the end of the herbaceous phase of the fruit
- berries switch from a status where they are small, hard and acidic, with little sugar to a status where they are larger, softer, sweeter, less acidic, and strongly flavoured and coloured
- ripening phase begins in August in the north hemisphere and lasts about 45 days, depending on the environmental conditions
- the berry approximately doubles in size between véraison and harvest
- the solutes accumulated in the grape berry during the first period of development remain at harvest; but due to the increase in berry volume, their concentration is significantly reduced
- malic acid is metabolized and used as an energy source during the ripening phase
- tannins also decline considerably on a per-berry basis after véraison
- lthough the first growth period contributes to the final quality of the berry, the most important event occurring during the second growth period is a massive increase in compounds, the major ones being glucose and fructose, as a result of a total biochemical shift into fruit ripening mode
References:
1. Text and berry illustration from: Carlos Conde, Paulo Silva, Natacha Fontes, Alberto C. P. Dias, Rui M. Tavares, Maria J. Sousa, Alice Agasse, Serge Delrot, Hernâni Gerós, Biochemical changes throughout Grape Berry development and fruit and wine quality, Food, 1(1), 1-22 ©2007 Global Science Books.
2. Illustration of the double sigmoid curve from: Moschou, Panagiotis & Aziz, Aziz & Roubelakis-Angelakis, Kalliopi, Chapter 7, Polyamines and grape berry development, The Biochemistry of the Grape Berry, (2012), 137-159.


No comments:
Post a Comment